Delegate365 protocols operations in it's audit logs. This log space can be accessed from entitled users and it's simple to create a custom Power BI dashboard for your Delegate365 data. See how this works here step-by-step.
Tip: The article Delegate365-Working with Audit Logs covers the methods for accessing the data and working with the audit logs as well. This article informs how to connect to your Delegate365 with Microsoft Power BI step-by-step and how create your custom dashboard. You need to have a Power BI license, see details at Power BI Pricing.
Follow these steps to work with Delegate365 audit data with Microsoft Power BI (click on the images to enlarge them).
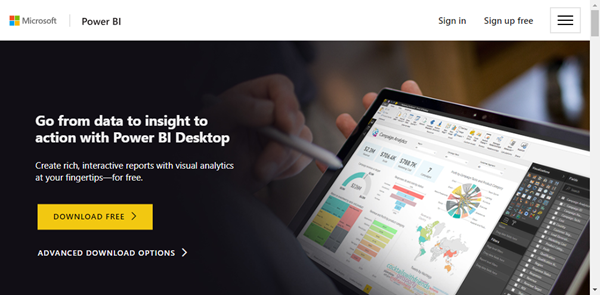
- If not already installed on you computer, download the free Power BI Desktop client from powerbi.microsoft.com.
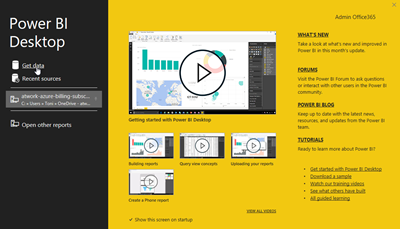
- When installed, start the Power BI Desktop app and select Get data.
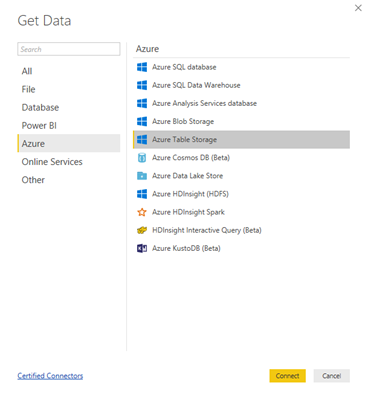
- In the Get Data dialog, select Azure / Azure Table Storage and click Connect.
- Change to your Delegate365 tenant and open Logs / Log Access. Click the Get account button. This opens the access data to your audit logs.
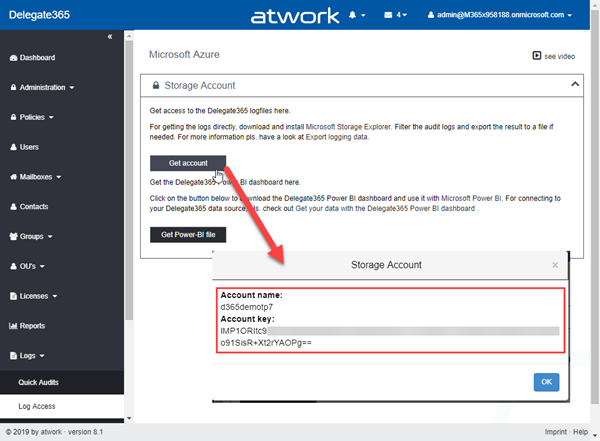
- Copy the Account name (here: d365demotp7) and the Account key (here: lMP1ORItc9...), best to a notepad.
- Change back to Power BI Desktop. Paste the Account name to the dialog box and click OK.

- Do the same with the Account key.
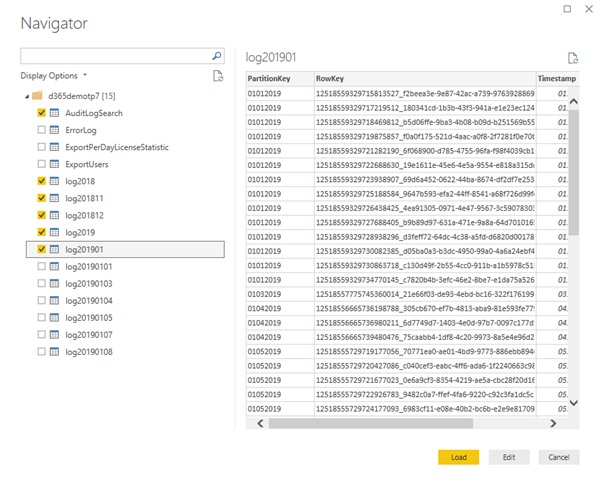
- In the Navigator dialog, select the tables you want to use:
AuditLogSearch is the "full log" over all times. Additionally, Delegate365 stores audit data in tables named log<year>, as log2018, log2019, etc. and per month, named log<month>, as log201811, log201812, log20191, etc. So, you should select AuditLogSearch and - if you want to speed up performance - the logs for years and or months. Click Load.
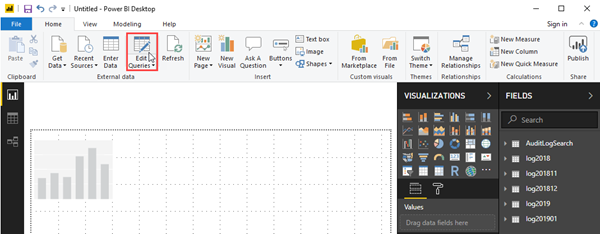
Power BI now loads the data from the Table storage. - Back in the editor mode, open the menu Edit Queries.
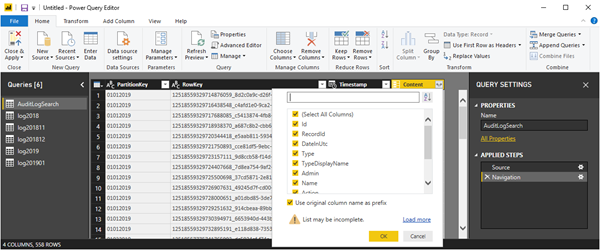
- In the Power Query Editor, you need to decompose the log data as here. Click on the grey Split icon right of the column header Content. This action discovers the data stored in that column and opens a menu, where all analyzed fields are already selected. Click OK.
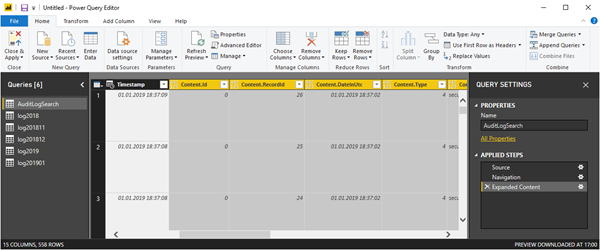
- You should see that new columns (yellow column headers) have been added and in the Applied Steps list on the right side, the Expanded Content step has been added. This step splits the JSON formatted log content in single columns. This is required to access the details.
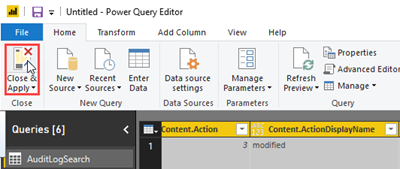
- Then, click the menu Close & Apply. The data modifications will be applied.
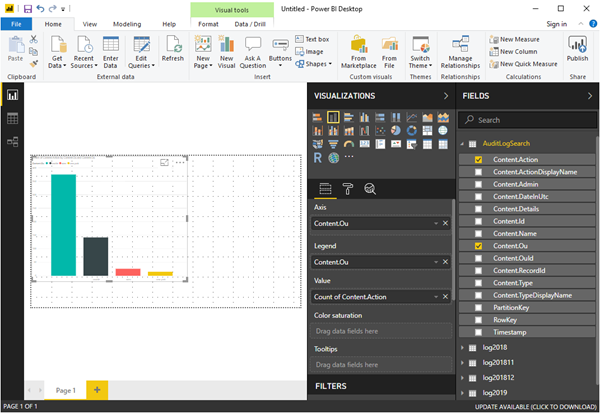
- Now you can start designing your dashboard. The AuditLogSearch table can now be expanded. In this sample, a new stacked column chart has been added to the content board and filled with data from Content.Ou and Content.Action. This visualization then shows the number of actions that happened in the OU's in the time frame (since the start of working with Delegate365).
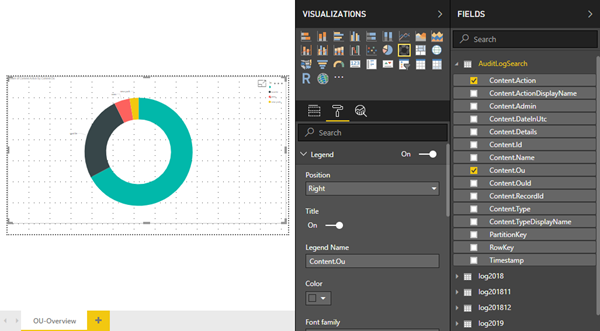
- Design your dashboard(s) as needed with the data provided directly from the audit logs. You can customize the visualizations by selecting the object, switching to another visualization and by clicking on the Format icon as here.
- You can update the data anytime by clicking the Refresh icon in the menu bar. This loads all data directly from the Delegate audit logs - you always get the latest data.
- Save your dashboard to you local computer, e.g. as MyDelegate365.pbix
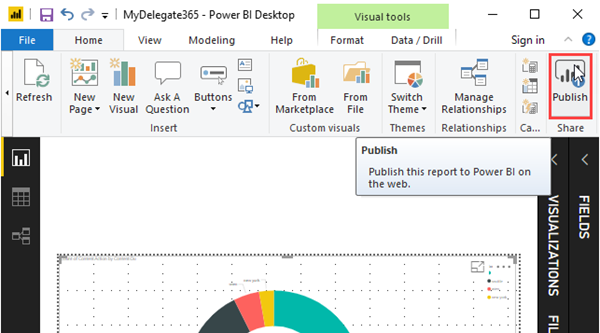
- To make the reports available online, click the Publish menu icon.
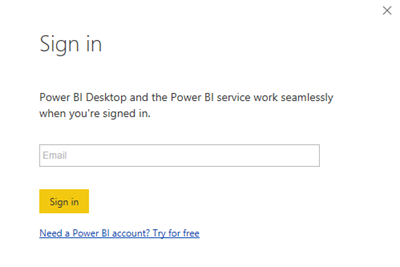
- If not already signed-in, you need to enter your Office 365 credentials.
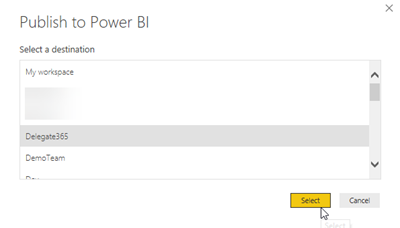
- Select an Office 365 group (a workspace) as destination. You reports will be published to that group.
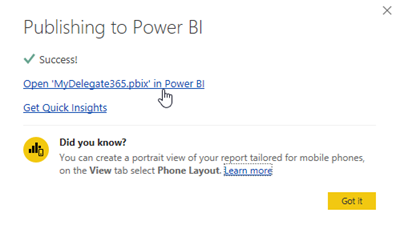
- You can open the report directly from here now. This opens the browser with your report URL that looks similar as https://app.powerbi.com/groups/someid/reports/someid/ReportSection
- Done. The reports are now available online and can be shared, subscribed, etc.
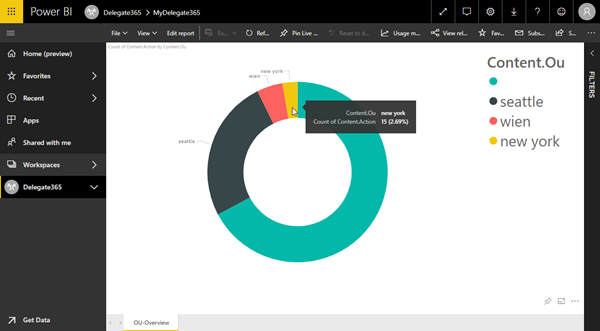
These easy steps allow to directly access the Delegate365 audit logs and to customize the visualization depending on your needs.