To apply governance in an organization, the responsible persons require data. See here, how we can get group data of an Office 365 tenant for further use, for example for a visualization with Microsoft Power BI and all the benefits of such an attractive and interactive tool.
Get all groups and their properties
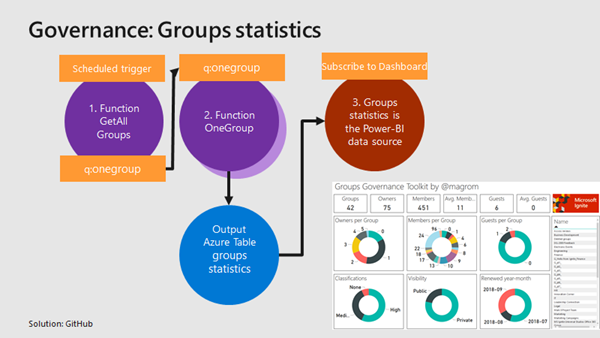
Again, we use the same mechanism as before, for getting orphaned groups and external users. For example, a function runs every day in the night and reads all existing groups in the Office 365 tenant. Every group is written to a queue for further processing, in the same way as the other functions did before. A second function is triggered by that queue and reads all the required group data for one group and writes the data into an Azure table. The following graphics shows that process from a technical standpoint.
This functionality requires an Azure storage account for providing the queue for the communication between the two functions, and a table for storing the result of the functions.
Create the Azure Functions for generating the statistics table
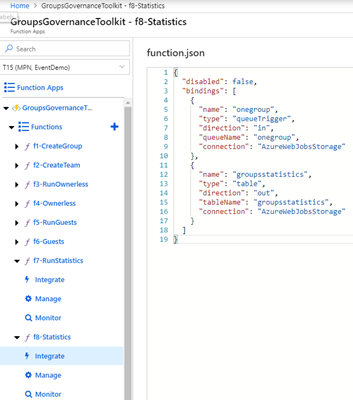
Create two new Azure Functions as in the article before, and paste the code for f7-RunStatistics and f8-Statistics into your code window. For communicating, we are using the bindings. Adapt them as provided at f7-RunStatistics/function.json (run daily at 1:30AM) and at f8-Statistics/function.json (listen to the queue and write to the table). The screenshot below shows the new bindings for f8-Statistics/function.json: The queue is accessed by the name "onegroup", the result will be written to table "groupsstatistics".
Clear the table first
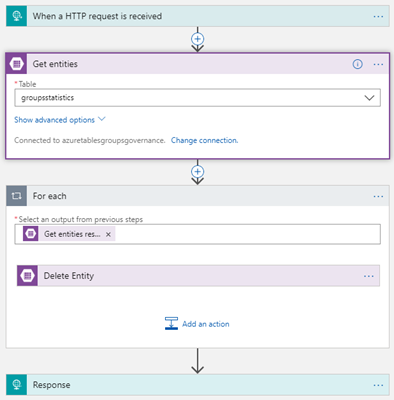
Before the function collect data, a Logic App "ClearGroupsStatistics" deletes all data that might be existing in out target table "groupsstatistics". We could delete the whole table and regenerate it after some wait time (about 10 seconds), or run through all records and delete them. Anyway, as result, the table shall be empty, so we can insert new data. This Logic App is called from our function code f7-RunStatistics at the beginning and looks as here.
Then, the groups data can be written to that table "groupsstatistics".
Let it run
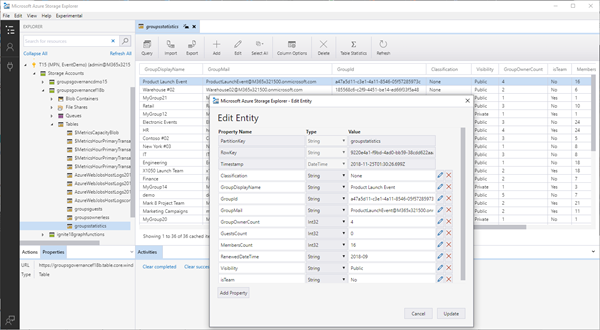
When f7-RunStatistics is executed, it will run through all groups in the Office 365 tenant, and call f8-Statistics for each group which fills the Azure table "groupsstatistics". So, after some minutes, depending on the number of groups and members, the data should be available in the table. You can use the cost free Azure Storage Explorer to connect and see (or modify) the data. The result should look like here.
The table contains the most relevant information about the existing Office 365 groups.
Visualize the data with Power BI
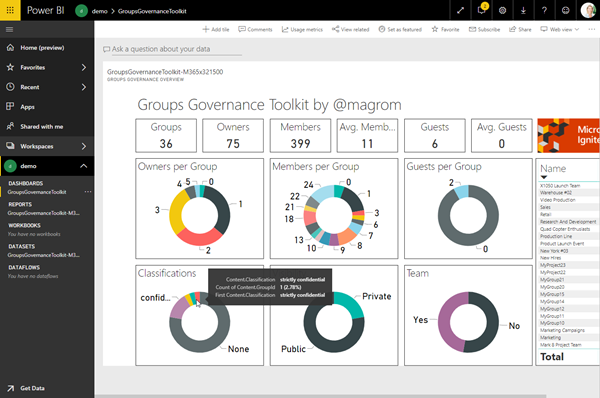
Now, that we have the data, it's easy to use them e.g. with Microsoft Power BI. Connect to the Azure storage and create your own dashboard for your own needs, similar as here.
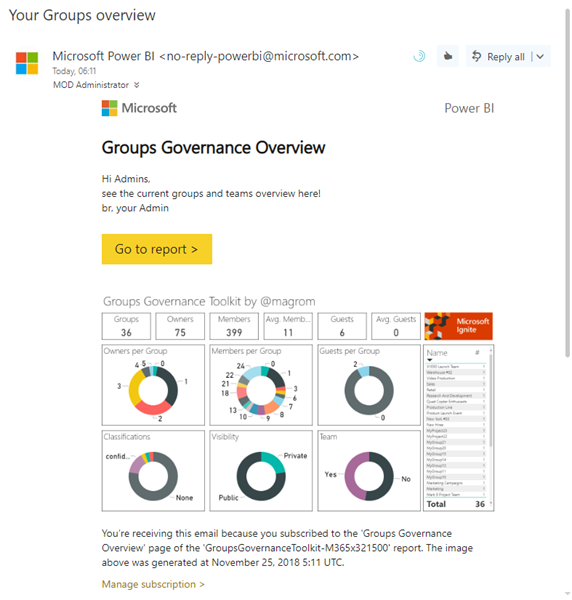
In Power BI, the report can be shared and users can subscribe to see changes in their inbox.
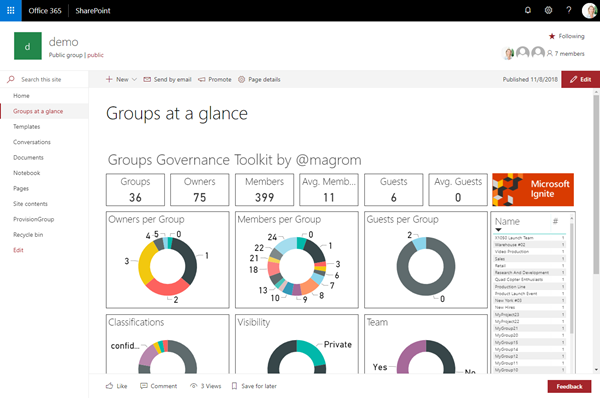
Alternatively, you can easily integrate that dashboard in a SharePoint site as webpart.
This workflow provides an Office 365 Groups overview at a glance for IT Administrators in daily life.
We hope this How-To series is useful and you liked our article series about Microsoft 365 Governance with Azure!
Office 365 Groups Governance Toolkit series
See all parts of the Office 365 Groups Governance Toolkit series here:
- Part 1 - Overview
- Part 2 - Provisioning requirements
- Part 3 - Develop Azure Functions
- Part 4 - Ownerless Groups
- Part 5 - External Guests
- Part 6 - Groups statistics
- Part 7 - Working with Group Policies
Categories: atwork, Azure, Cloud, Developer, English, Microsoft, Microsoft365, MVP, Office365, PowerShell, SharePoint, Tools
Source: https://blog.atwork.at/post/Groups-Governance-Toolkit-Part-6-Groups-statistics
